Zeitpunkt              Nutzer    Delta   Tröts        TNR     Titel                     Version  maxTL
So 02.06.2024 00:00:08     9.840       0      506.910    51,5 Climate Justice Social    4.2.9... 5.000
Sa 01.06.2024 00:00:18     9.840       0      505.867    51,4 Climate Justice Social    4.2.9... 5.000
Fr 31.05.2024 00:00:06     9.840       0      504.806    51,3 Climate Justice Social    4.2.8... 5.000
Do 30.05.2024 00:00:08     9.840       0      503.920    51,2 Climate Justice Social    4.2.8... 5.000
Mi 29.05.2024 00:00:08     9.840       0      502.968    51,1 Climate Justice Social    4.2.8... 5.000
Di 28.05.2024 00:00:12     9.840      -1      502.181    51,0 Climate Justice Social    4.2.8... 5.000
Mo 27.05.2024 00:00:10     9.841      +3      501.305    50,9 Climate Justice Social    4.2.8... 5.000
So 26.05.2024 00:00:02     9.838       0      500.639    50,9 Climate Justice Social    4.2.8... 5.000
Sa 25.05.2024 00:00:10     9.838      +1      500.026    50,8 Climate Justice Social    4.2.8... 5.000
Fr 24.05.2024 00:00:08     9.837       0      498.998    50,7 Climate Justice Social    4.2.8... 5.000
Ketan Joshi (@ketan) · 11/2022 · Tröts: 91 · Folger: 1.756
So 02.06.2024 08:26
It is obviously important that we measure how carbon moves from biomass to air, or from air to biomass, due to human choices.
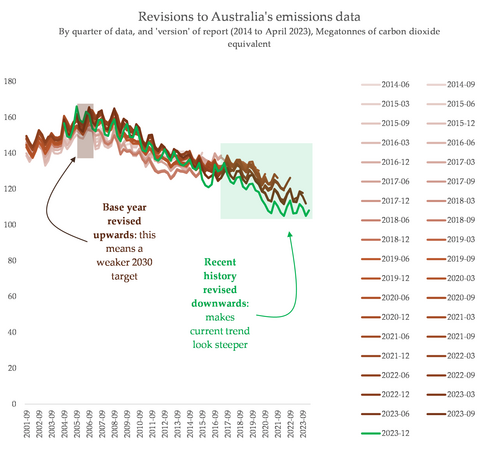
But the inherent uncertainty, uniqueness and complexity of emissions measurements here seems to have turned it into a massive engine of climate delay, in Australia.
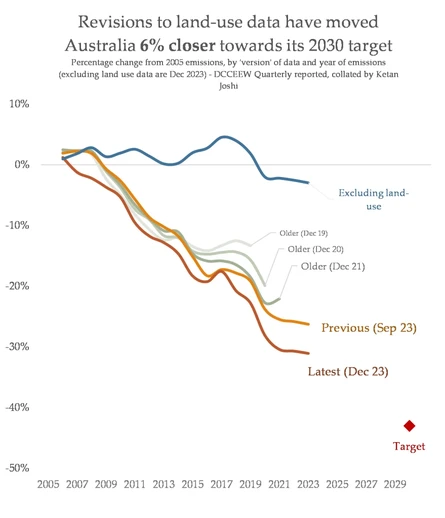
I've been tracking revisions to the dataset for five years, every major revision has seen the base year rise, and recent years fall, making target achievement easier for both the Liberals and the Labor party. The most recent change is worse than ever: moving Australia 6% closer towards its 2030 target in the time it took to publish the PDF (equivalent to five years of deployment of wind and solar).
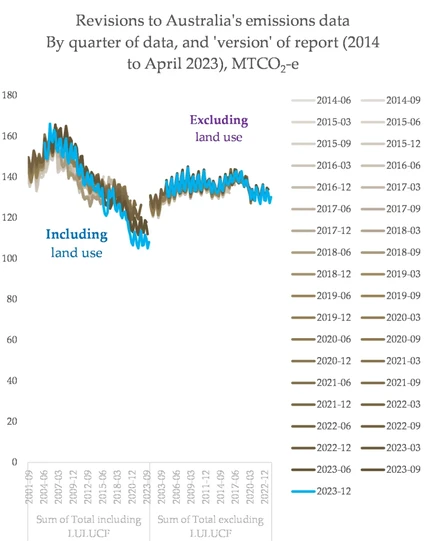
Transport, industry, fossil mining and agriculture emissions in Australia are not falling. The power sector's reductions are slowing down. And this situation is being wholly masked by unreliable, massive revisions to Australia's land use sector.
Have a read of my post here:

a chart showing the percentage change from adjusting land use data

a chart showign the difference between adjutse and unadjusted data

a chart showing how reivisons to autralia's data change the narrative
[Öffentlich] Antw.: 0 Wtrl.: 3 Fav.: 4 · via Web